One Dashboard for Every Sensor, Every Site.
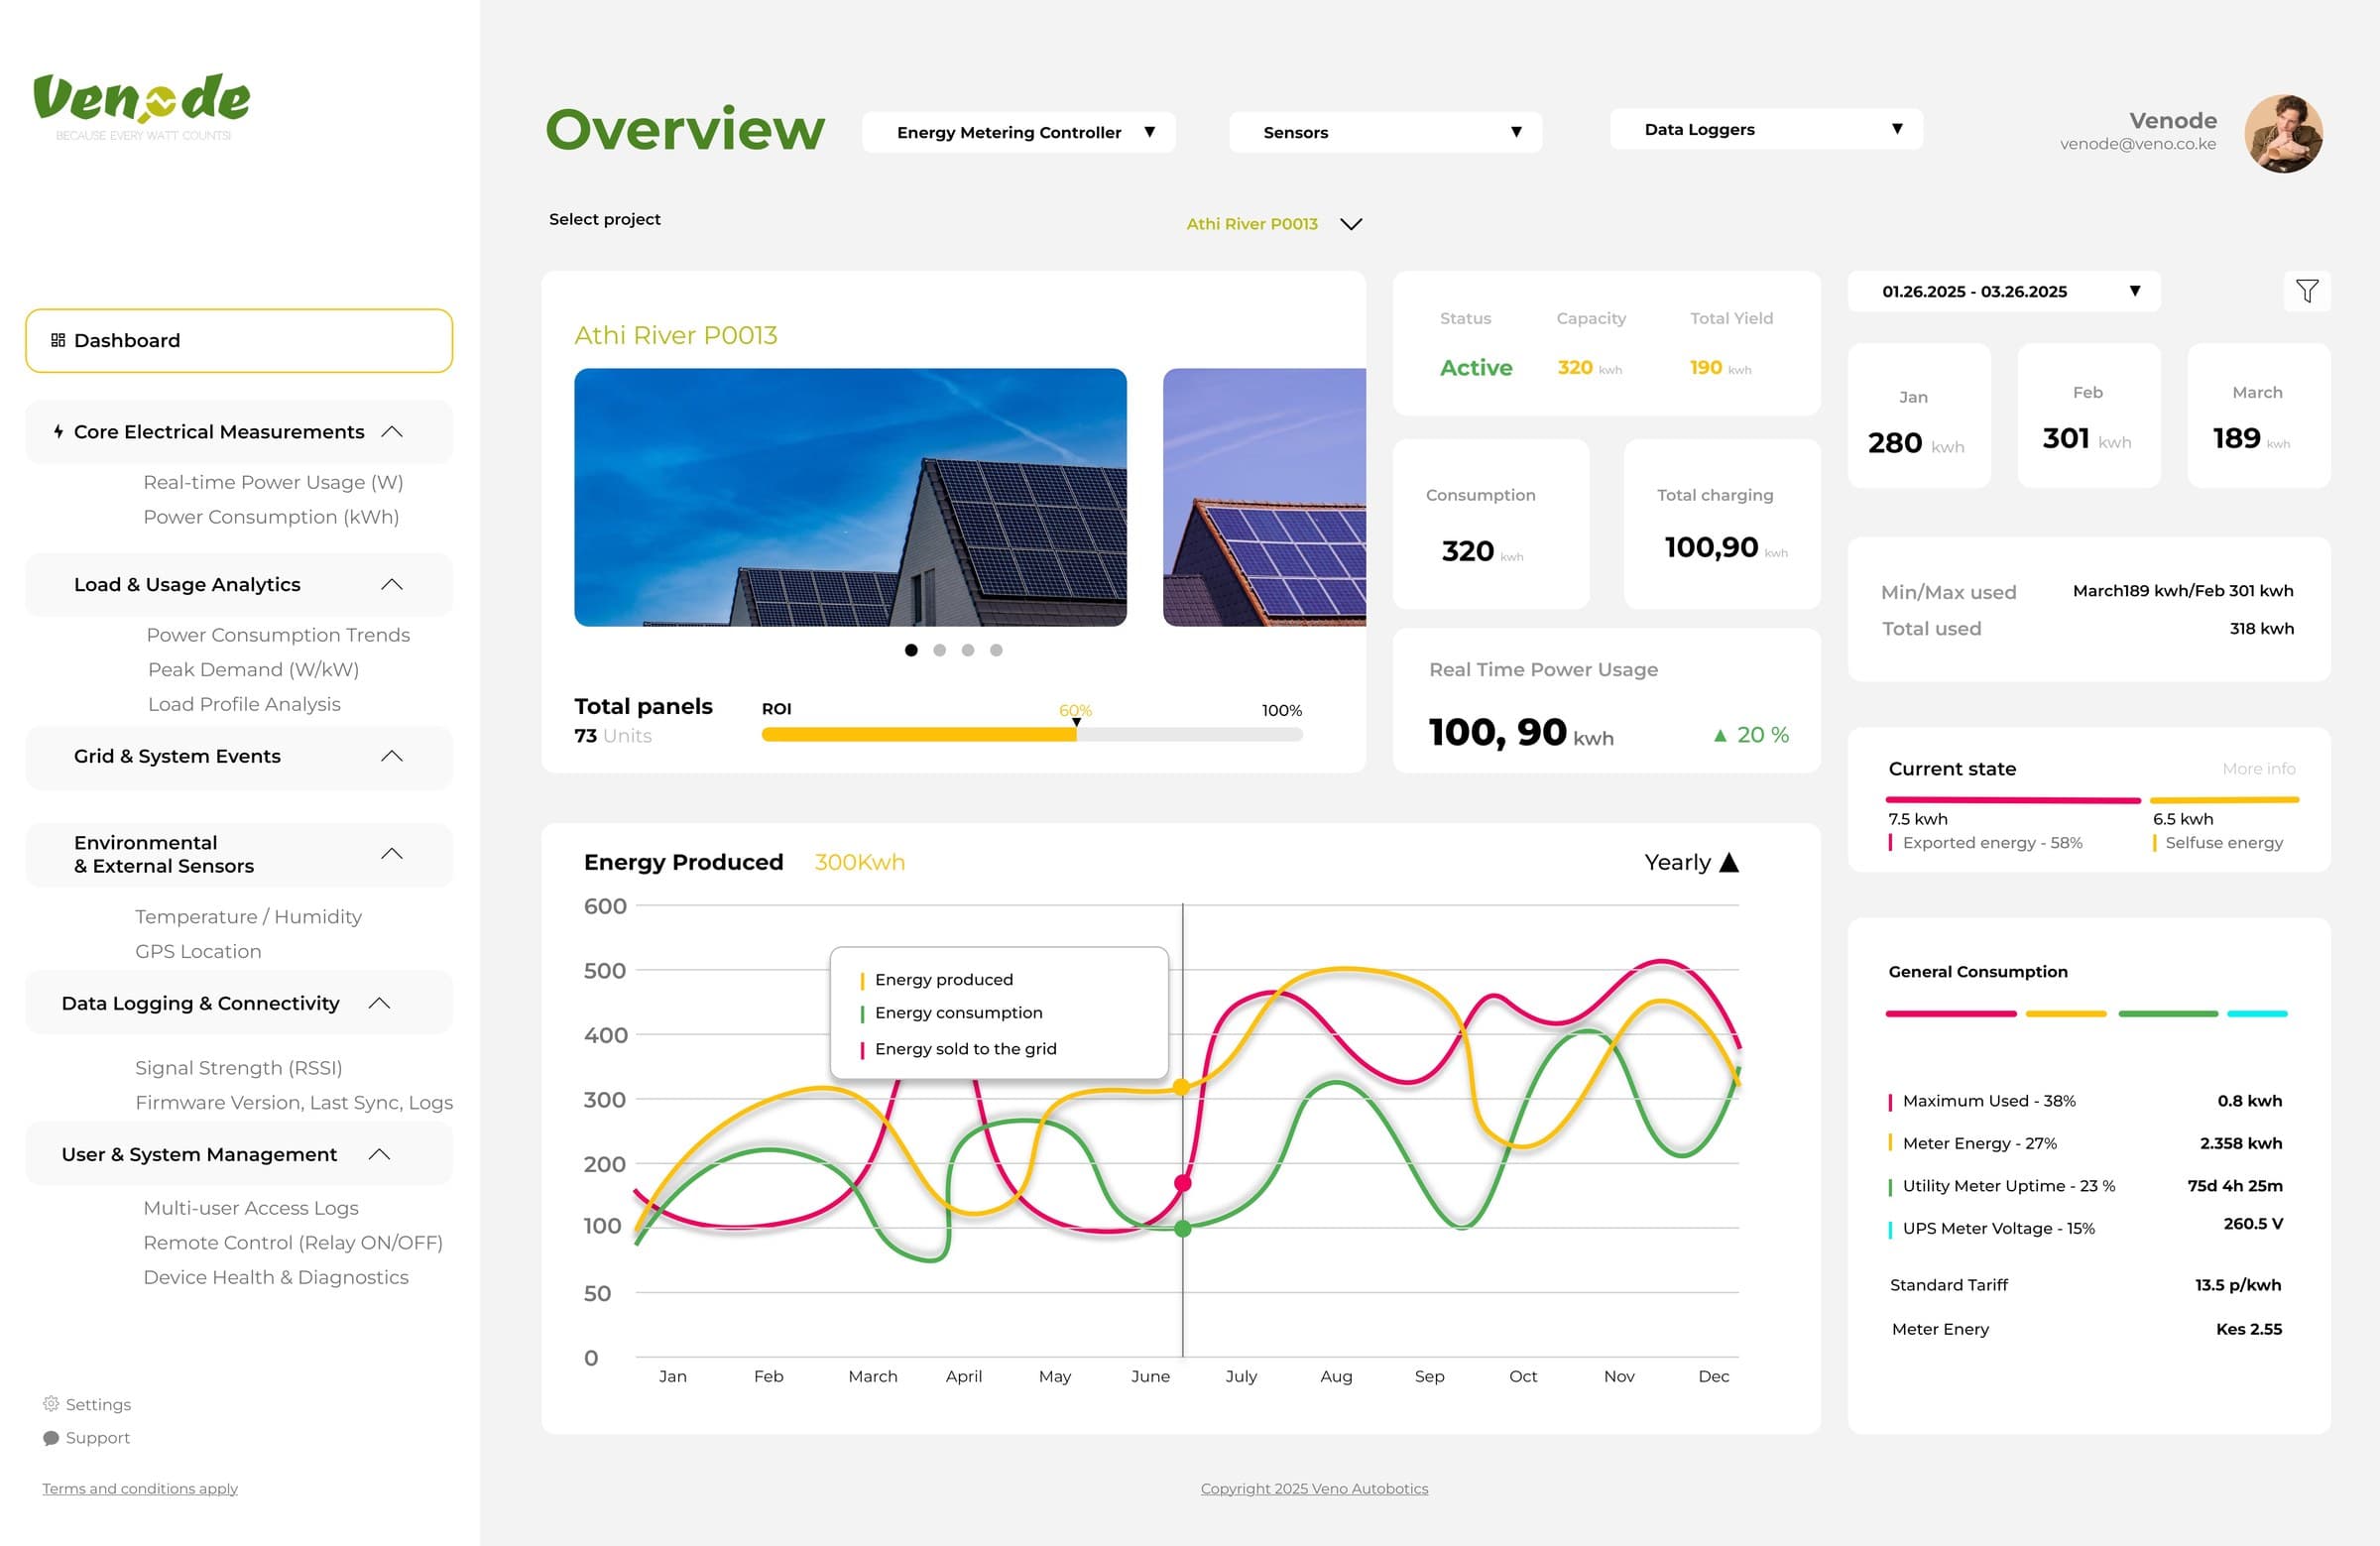
Monitor smart meters and sensors across all your locations. Get alerts when something's wrong. See historical trends. Know what's happening before someone has to call you.

Average sensor uptime visibility across all connected sites.
Average time to detect a fault or offline sensor.
Continuous monitoring across every connected site.
Flexible plans from 10 sensors to unlimited.
Average sensor uptime visibility across all connected sites.
Average time to detect a fault or offline sensor.
Continuous monitoring across every connected site.
Flexible plans from 10 sensors to unlimited.
Average sensor uptime visibility across all connected sites.
Average time to detect a fault or offline sensor.
Continuous monitoring across every connected site.
Flexible plans from 10 sensors to unlimited.
Your Sensors Are Installed. Your Visibility Isn't.
If your monitoring depends on someone remembering to check, it's not really monitoring. It's hoping.
Blind spots
A sensor goes offline at 2 AM and nobody knows until the morning shift arrives.
Scattered data
Every site has its own setup. You’re pulling readings from five different systems into one spreadsheet.
Slow response
By the time you find out a reading is out of range, the damage — to equipment, inventory, or reputation — is already done.
From Installed Hardware to Live Operational Insight
A direct, four-step journey from unboxing a sensor to automated monitoring across every site.

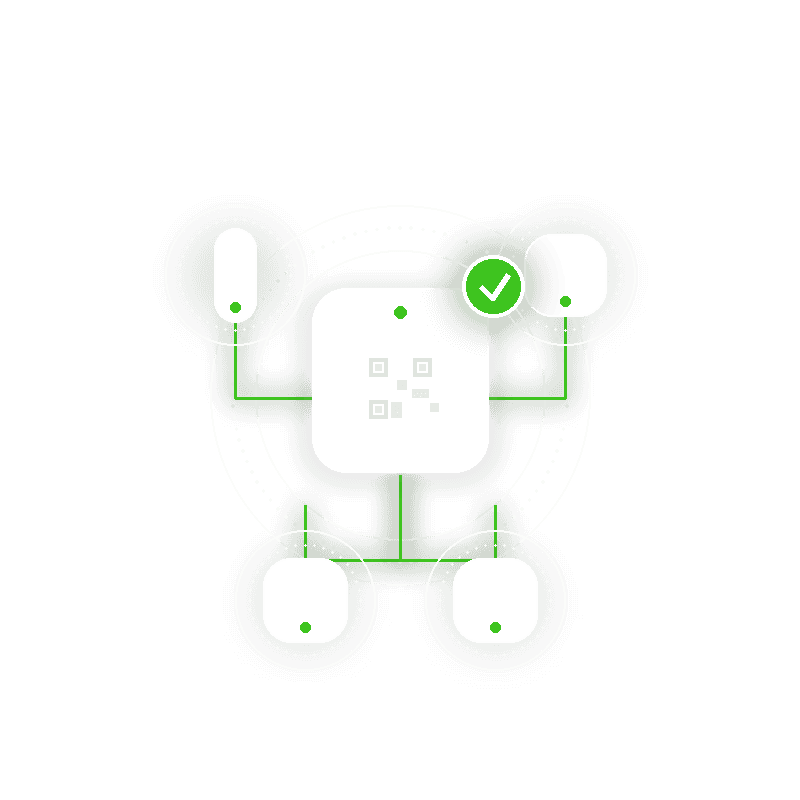
Connect & Pair Devices in Minutes
Scan a code or plug it in — a sensor is live on your dashboard before the installer leaves the site.
One activation code per install, valid for 30 minutes.
Bulk-ship hardware that activates itself on first boot.
Each sensor lands on the right site automatically.




Every Sensor, Every Site, Clear in One Operational View.



Everything else, built in
The details that make a monitoring platform actually usable day to day.
MQTT & HTTPS ingestion
Sensors report over MQTT or HTTPS. Identity comes from credentials, not payload — no spoofing possible.
Time-series dashboards
Charts auto-switch resolution: raw for 24 hours, hourly for 30 days, daily beyond. No manual aggregation.
CSV & PDF exports
Export readings as CSV instantly, or receive large exports by email. Download invoices as PDF.
Threshold & offline alerts
Set rules on any metric. Get notified via email or SMS the moment a reading breaches or a sensor goes silent.
Multi-site, multi-tenant
Organize sensors by site, each with its own timezone. Manage sub-organizations for reseller deployments.
Graceful degradation
Past-due accounts keep dashboards live. Alerts still fire. Only writes pause until payment is restored.
Where Venode Works
Real scenarios across industries where continuous sensor monitoring changes how operations run.
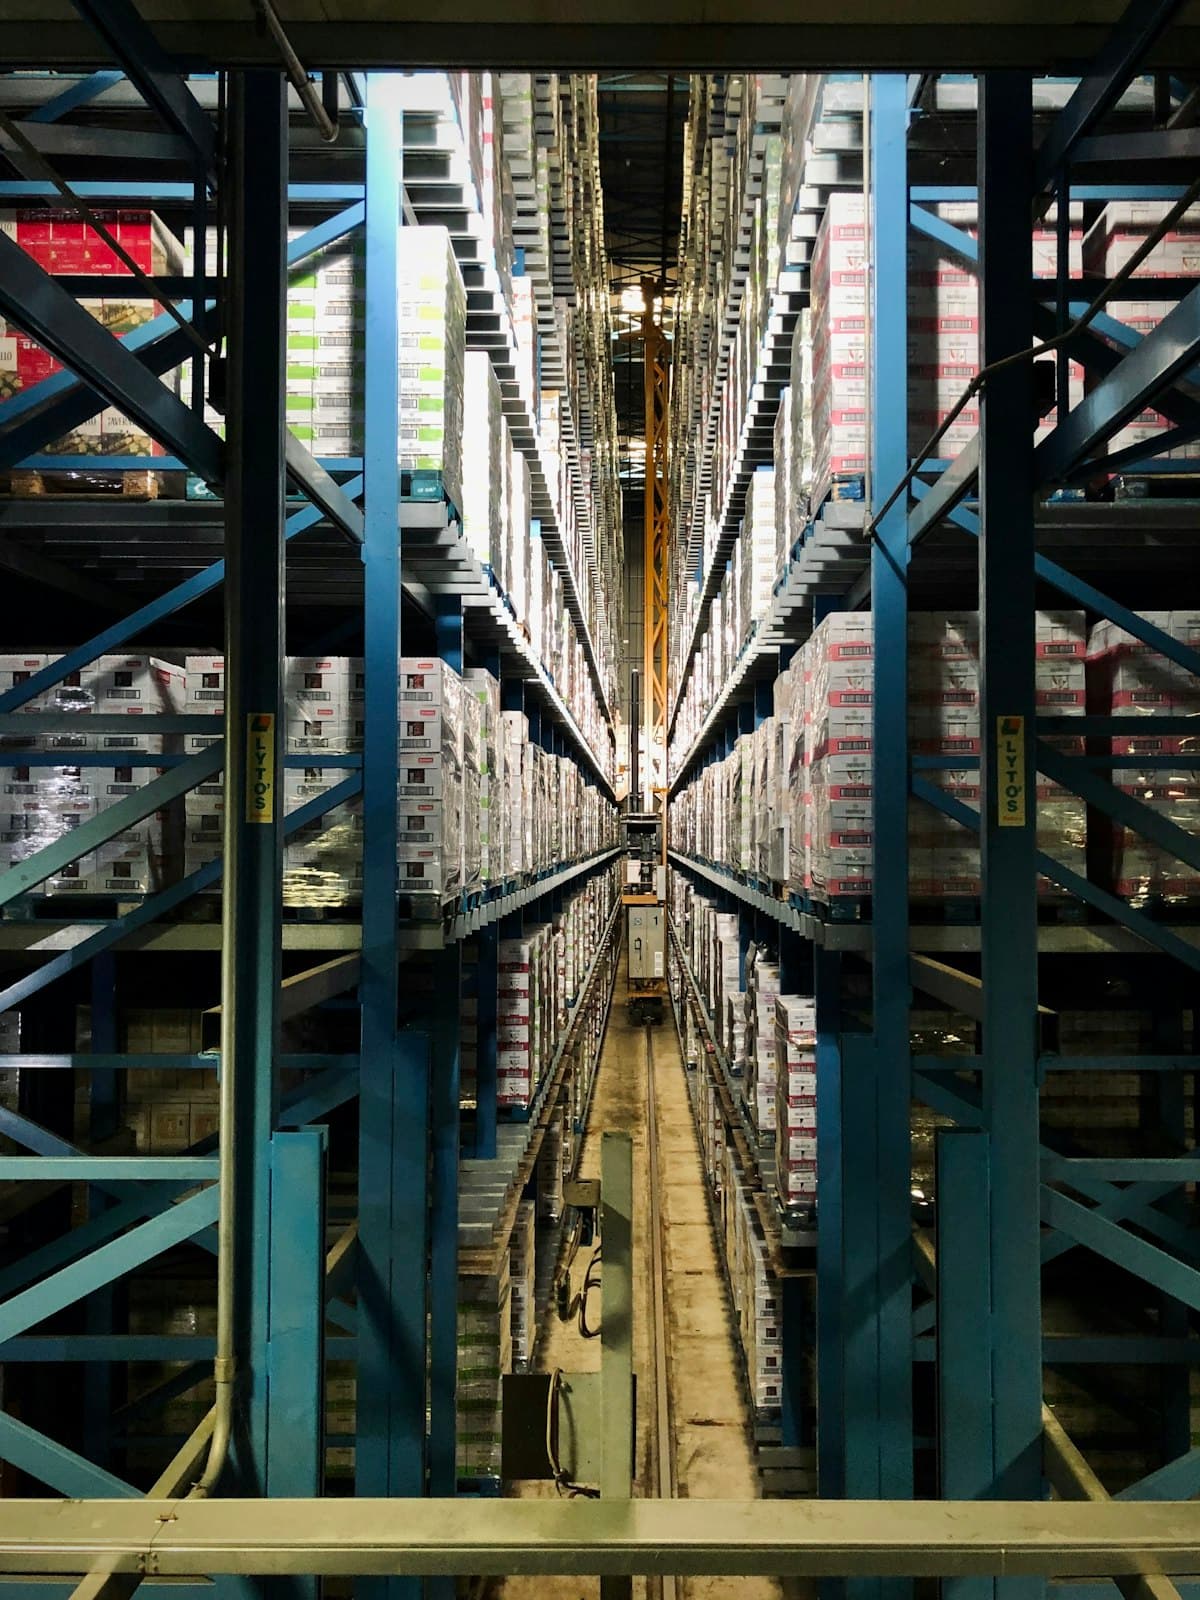
Spot Temperature Swings Instantly
Food & Beverage
Distribution & Cold Storage

Track Power Use, Site by Site
Commercial Real Estate
Energy & Facilities Management

Watch Voltage, Machine by Machine
Manufacturing
Equipment Operations
Questions?
Whether you’re new or exploring deeper support, we know you may have questions.
What kinds of sensors does Venode work with?
Any sensor or smart meter that can report over MQTT or HTTPS. The platform is protocol-level, not vendor-locked — if your device can send a reading, Venode can ingest it.
How does onboarding a sensor work?
Two ways: your admin generates a short-lived activation code and the device redeems it on-site, or our team pre-registers a hardware ID before shipping and the sensor activates itself on first boot.
What happens if I don’t pay on time?
Your dashboards stay live — you can still see all your data and review alerts. You just can’t add new sensors, sites, or alert rules until payment is restored. No data goes dark.
How does pricing work?
Per active sensor, per month. You only pay for sensors that are currently onboarded and active. Disabled or offline sensors don’t count. Three tiers: Starter (up to 10), Pro (up to 50 with SMS alerts), and Industrial (unlimited).